Visualization
Contents
1. Visualization output with -vis
tlog and trice log support the same repeatable -vis option for sending selected numeric measurements to external visualization tools. Consumers can, for example, be LabPlot, Serial Studio, PlotJuggler, uPlot, Grafana, or a custom program; these names do not imply a tool-specific protocol. Trice itself does not draw a graph. It transforms one typed Trice message into one user-defined text record and writes that record to a file or UDP destination.
The syntax is:
-vis='<tag>:printf("<go-fmt>",<expression-list>)@<file-path-or-udp-sink>[;log=keep|drop]'
For example, this target message keeps its visualization details independent of the host tool:
TRice("imu:ax=%f,ay=%f,az=%f\n", aFloat(ax), aFloat(ay), aFloat(az));
It can be written as CSV:
tlog ... \
  -vis='imu:printf("%d,%0.3f,%0.3f,%0.3f\n",ts32,v0,v1,v2)@imu.csv'
or sent as one UDP datagram per record:
tlog ... \
  -vis='imu:printf("%0.3f,%0.3f,%0.3f\n",v0*0.5,v1*0.5,v2*0.5)@udp://127.0.0.1:7010;log=drop'
To collect temperatures from warning messages in a CSV file, suppose your firmware uses a project macro MyWrn, registered as a Trice alias:
MyWrn("err:temperature=%u\n", 85);
Run this command in the directory containing the firmware’s matching til.json, replacing COM7 with your serial port:
trice log -p COM7 -vis='wrn:printf("%d\n",v0)@warnings.csv'
Each time that call arrives, this line is appended to warnings.csv:
85
Here, wrn means “take warning messages”, v0 is their first numeric value, and @warnings.csv names the output file. The name MyWrn makes this a warning even though its text begins with err:. Changing the rule to err:printf(...) would exclude this message. wrn, WRN and WARNING select the same warnings.
For a custom name that has not been registered with -utag, the start of the text decides. For example, -vis='imu:printf("%d\n",v0)@imu.csv' writes 21 from trice("imu:temperature=%u\n", 21), but ignores text starting with IMU:. With -utag imu, both spellings select the IMU tag; a warning alias still belongs to warnings even if its text starts with imu:.
-pick and -ban run first. A message removed by either filter reaches neither normal output nor -vis.
The supported fields are:
id                unsigned Trice ID
ts                raw 16- or 32-bit Target-Stamp, with one width latched per rule
ts16              raw 16-bit Target-Stamp
ts32              raw 32-bit Target-Stamp
v0 ... v11        typed positional Trice values
The value fields are positional and can be reordered in the expression list. -vis does not extract names such as ax or rpm from the human-readable target format and does not accept those names as identifiers. For example, printf("%g,%g\n",v2,v0) deliberately emits the third value before the first. Structured Logging field names are not visualization expression identifiers; use v0 through v11 for this interface.
A Target-Stamp is an unscaled number. -vis does not assume that it represents time and does not perform unit conversion, wrap extension, or mixed-width reconstruction. Scaling is explicit in an expression, for example ts32*0.001. A rule may use ts16 or ts32, but not both. A generic ts rule is disabled with a warning if an otherwise eligible message later changes between 16 and 32 bits.
Separate rules make the expected stamp width explicit:
tlog ... \
  -vis='fast:printf("%d,%g\n",ts16,v0)@fast.csv' \
  -vis='slow:printf("%d,%g\n",ts32,v0)@slow.csv'
Expressions support decimal, floating-point, and hexadecimal literals, parentheses, unary minus, and +, -, *, /. A direct field retains its signed, unsigned, floating-point, or Boolean type. Arithmetic is evaluated as float64. A floating result used with an integer verb must be finite and inside the int64 range; it is then truncated toward zero.
The printf encoder supports:
integer:       %d %b %o %x %X
floating:      %f %e %E %g %G
generic:       %v
Boolean:       %t with a direct Boolean field
literal:       %%
formatting:    literal width and precision, such as %08x or %0.3f
%u, dynamic * width or precision, explicit argument indexes, string conversions, and other Go formatting verbs are not supported. The expression count must equal the number of consuming verbs. The encoder adds no implicit newline; include \n in the format when the receiving tool expects one. A one-line JSON record is possible as well:
tlog ... \
  -vis='imu:printf("{\"stamp\":%d,\"x\":%g,\"y\":%g,\"z\":%g}\n",ts32,v0,v1,v2)@udp://127.0.0.1:7011'
A bare path and file:<path> both select an append-only file:
@out.csv
@logs/imu.csv
@file:out.csv
Missing files are created. Rules using the same normalized file path share one open file. file://out.csv is rejected because standard URI parsing treats out.csv as a host, not as a relative path. Full file-URI semantics are not part of this implementation.
UDP destinations use:
@udp://127.0.0.1:7010
@udp://localhost:7010
The address is resolved and opened before decoding starts. File and UDP writes are synchronous. There is no queue, retry, reconnect, acknowledgement, TCP, WebSocket, or named-pipe support in this first implementation.
log=keep is the default and leaves the decoded message in normal output. log=drop removes it from normal output only after that rule has encoded and written the visualization record successfully. All overlapping rules are still attempted; one successful log=drop rule wins. An ignored record or a failed encoder or sink write does not drop the normal log.
Only fixed-width numeric Trice messages are eligible. The first twelve values are addressable as v0 through v11; additional values do not prevent a rule from using that addressable prefix and remain available to normal logging. Trice string, buffer, function-display, character, typeX0, CHAR, and DUMP inputs are not supported. Named values, specialized JSON or binary encoders, TCP, WebSocket, named pipes, and process pipes are deferred behind the same selector/encoder/sink separation. One eligible Trice must also form one complete log line by itself. Partial, multi-line, and multi-Trice lines continue through normal logging but are ignored by -vis; verbose mode reports every such occurrence.
At startup, each rule checks all matching historical til.json entries. Incompatible old entries are excluded independently, so one stale ID does not block another compatible ID. A rule with no compatible entry is disabled with a prominent warning. Rules are also disabled, never silently, after a generic Target-Stamp width conflict, an unsafe runtime expression conversion, or a sink failure. Normal logging continues.
2. Setting up the LabPlot Demo
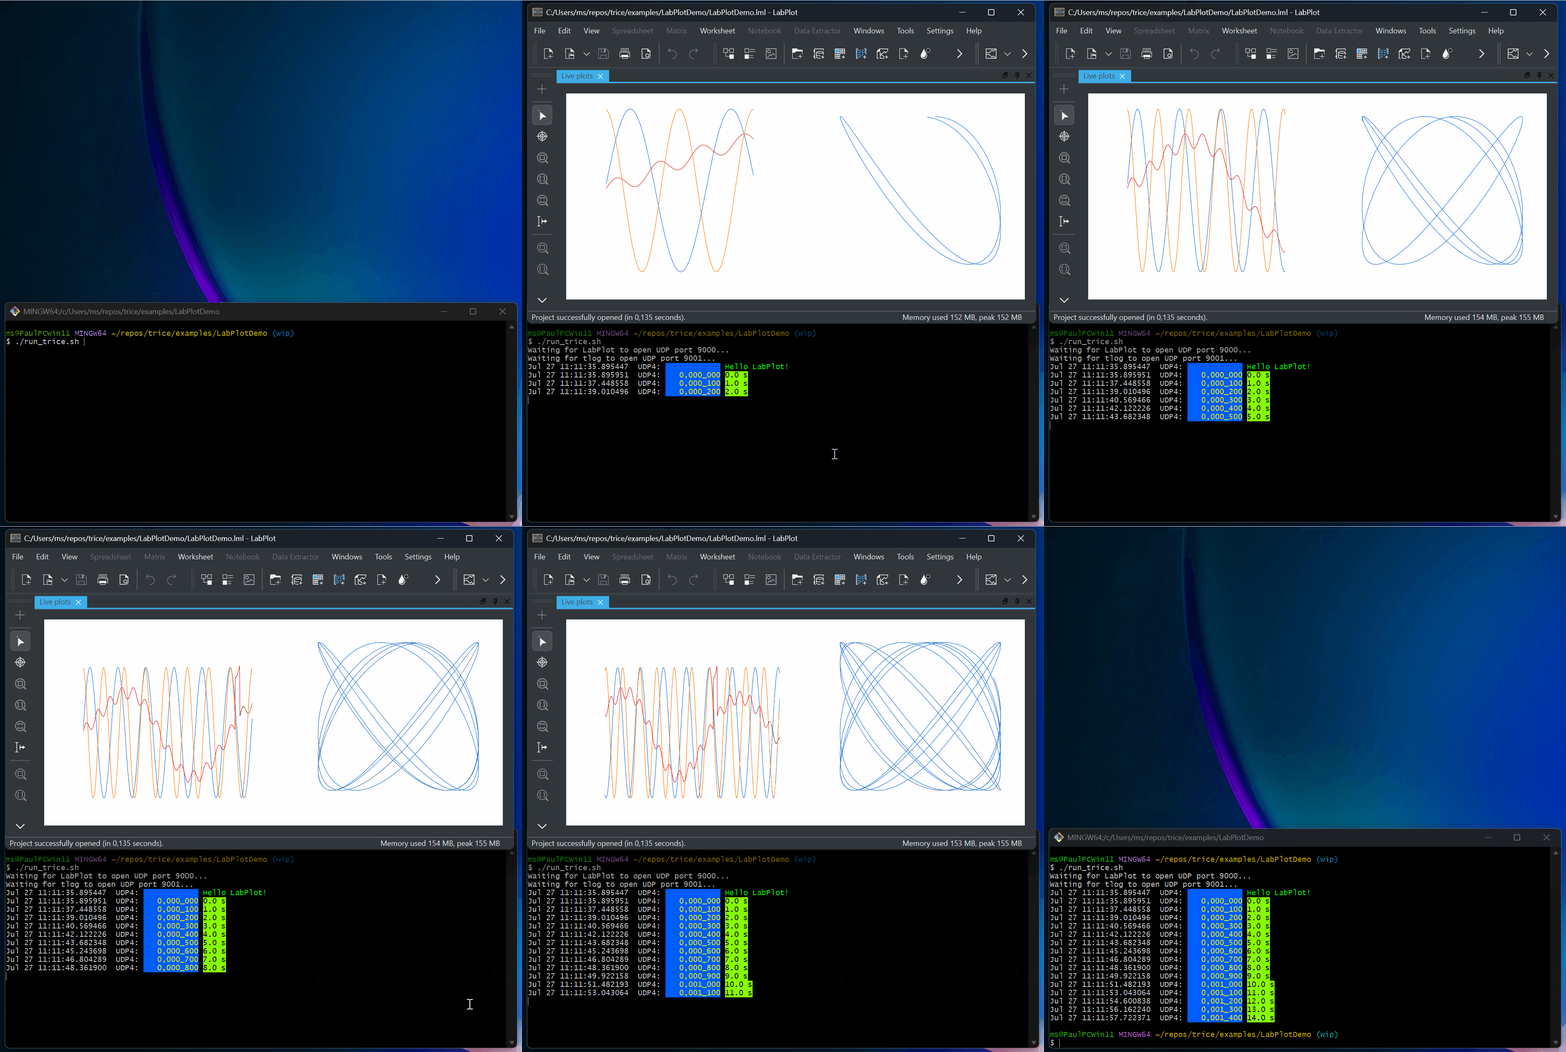
Select the preview to open the full animation.
This section uses LabPlot, a cross-platform interactive
plotting application. The finished, ready-to-run example is in
./examples/LabPlotDemo/; the guided learning path is in
./examples/LabPlotUser/. The project uses a UDP socket so that it can
display an endless stream without repeatedly importing files.
2.1. The common live-data format
Both producers describe the same three signals: x, y, and z. LabPlot
receives normalized numeric CSV records with this column layout:
time_s,x,y,z
The finished project predeclares the four numeric columns and performs one initial read while loading. This prepares LabPlot’s UDP socket before the first live record arrives. The UDP stream therefore needs no header row.
The LabPlot demo rate is 50 samples per second. The project retains 500 rows.
The time plot is configured for the last 500 values, so its horizontal
resolution stays constant and it always displays approximately the most
recent ten seconds. The Lissajous plot uses only the last 150 values, which
creates a moving three-second trace instead of an increasingly dense full
history. A slow phase modulation of y makes the figure change continuously.
The CSV producer sends this format directly. The Trice producer sends binary
Trice records to tlog; tlog decodes them and sends the same CSV format
onward. This separation means that one LabPlot project works for both
examples.
2.2. ./examples/DemoData_CSV
The CSV producer is a small C11 program
for Windows, macOS, and Linux. Each newline-terminated record contains
time_s,x,y,z, all represented as double; time is in seconds. It writes to
standard output by default, to a fresh file with --output FILE, or to UDP
with one record per datagram. Use --help for all options.
Both data producers require a C compiler and CMake 3.16 or newer. Run their
build.sh in Git Bash on Windows or a POSIX shell on macOS/Linux; restore its
executable permission with chmod +x build.sh if necessary. Executables are
installed in each project’s bin/, with intermediate files in build/.
For the CSV producer, the equivalent explicit CMake commands are:
cd examples/DemoData_CSV
cmake -S . -B build
cmake --build build --config Release
cmake --install build --config Release --prefix .
These commands also work in PowerShell. Its executable invocation is
.\bin\DemoData_CSV.exe; in Git Bash use ./bin/DemoData_CSV.
From the CSV project directory, try:
./build.sh
./bin/DemoData_CSV
./bin/DemoData_CSV --rate 50 --samples 500 --no-delay --header --output DemoData_CSV.csv
./bin/DemoData_CSV --udp 127.0.0.1 9000
Run these alternatives separately. The second command runs continuously at
50 Hz; interrupt it with Ctrl-C. The third writes ten seconds of data
without real-time waiting. On Windows PowerShell the UDP command is
.\bin\DemoData_CSV.exe --udp 127.0.0.1 9000.
For Serial Studio, choose Quick Plot (Comma Separated Values), then
Network Socket > UDP, set local port 9000, connect, and start the UDP
producer. Quick Plot treats all four columns as values. A custom project can
instead name the columns and use the first column as a timestamp axis. Its
input must be seconds,x,y,z; do not send --header on the live stream.
There is currently no versioned DemoData.ssproj in this repository.
Both producers use the following signal model for time t in seconds:
phase = (pi/3) * sin(2*pi*0.04*t)
x = sin(2*pi*0.70*t)
y = sin(2*pi*0.91*t + pi/2 + phase)
z = 0.6*sin(2*pi*0.13*t) + 0.2*x*y + pulse
The pulse has height 0.8 during the final 250 ms of every eight-second
interval. The slow phase modulation keeps the Lissajous plot moving. The
Trice producer calculates the signals as doubles and transmits float32 values.
After running build.sh inside ./examples/DemoData_CSV/, the executable is
installed in the local bin/ folder. You can run it there:
th@Thomass-MacBook-Pro-7 bin % ./DemoData_CSV --header -o log.csv
^C
th@Thomass-MacBook-Pro-7 bin % head log.csv
time_s,x,y,z
0.000000,0.000000,1.000000,0.000000
0.020000,0.087851,0.992854,0.027246
0.040000,0.175023,0.971519,0.053608
0.060000,0.260842,0.936300,0.078239
0.080000,0.344643,0.887701,0.100367
0.100000,0.425779,0.826415,0.119328
0.120000,0.503623,0.753319,0.134594
0.140000,0.577573,0.669459,0.145795
0.160000,0.647056,0.576032,0.152736
th@Thomass-MacBook-Pro-7 bin %
2.3. ./examples/DemoData_Trice
The Trice producer transports the
same signals as binary Trice records. Keep it inside the repository: its
CMake project uses the unchanged target library from ../../src.
Its build script prepares Bind and the
repository-root demoTIL.json before building; it requires the Trice host
tool in addition to the CSV producer’s prerequisites. Use this script rather
than plain CMake commands that omit Bind preparation. There is no private
til.json or fixed iD(1000) for this ID-free producer.
The 32-bit target stamp uses units of 10 ms: at 50 Hz the stamps are
0, 2, 4, .... Convert with seconds = ts/100.0 or
milliseconds = ts*10; ts*100 does not give seconds.
From examples/DemoData_Trice:
./build.sh
./bin/DemoData_Trice --samples 500 --no-delay
trice log -p FILEBUFFER -args DemoData_Trice.bin -pf TCOBS -til ../../demoTIL.json -li off
Without an output option, the producer recreates DemoData_Trice.bin in the
current directory (wb truncates its previous contents). --output FILE
selects another fresh file, --stdout writes binary data to standard output,
and --udp HOST PORT sends one complete TCOBS-framed record per datagram.
Without --samples it runs until interrupted. --samples 500 counts signal
samples, not all log records: startup and periodic diagnostic logs are extra.
Use --help for all options. On Windows PowerShell, run
.\bin\DemoData_Trice.exe with the same arguments.
After running build.sh inside ./examples/DemoData_Trice/, the executable is
installed in the local bin/ folder. You can run it there:
- Create binary log file:
th@Thomass-MacBook-Pro-7 bin % ./DemoData_Trice -o log.bin
Writing log.bin
^C
- Show logs in binary log file:
th@Thomass-MacBook-Pro-7 bin % tlog -p FILEBUFFER -args log.bin -til ../../../demoTIL.json -utag vis_demo | head
Jul 25 15:38:55.411676  FILEBUFFER:    0,000_000 0.000000,1.000000,0.000000
Jul 25 15:38:55.411691  FILEBUFFER:    0,000_002 0.087851,0.992854,0.027246
Jul 25 15:38:55.411705  FILEBUFFER:    0,000_004 0.175023,0.971519,0.053608
Jul 25 15:38:55.411714  FILEBUFFER:    0,000_006 0.260842,0.936300,0.078239
Jul 25 15:38:55.411725  FILEBUFFER:    0,000_008 0.344643,0.887701,0.100367
Jul 25 15:38:55.411737  FILEBUFFER:    0,000_010 0.425779,0.826415,0.119328
Jul 25 15:38:55.411752  FILEBUFFER:    0,000_012 0.503623,0.753319,0.134594
Jul 25 15:38:55.411765  FILEBUFFER:    0,000_014 0.577573,0.669459,0.145795
Jul 25 15:38:55.411776  FILEBUFFER:    0,000_016 0.647056,0.576032,0.152736
th@Thomass-MacBook-Pro-7 bin %
- Get CSV log file:
th@Thomass-MacBook-Pro-7 bin % tlog -p FILEBUFFER -args log.bin -til ../../../demoTIL.json -utag vis_demo -vis='vis_demo:printf("%0.3f,%0.3f,%0.3f,%0.3f\n",ts/100.0,v0,v1,v2)@log.csv;header="time_s,X,Y,Z\n";log=drop'
th@Thomass-MacBook-Pro-7 bin % head log.csv
time_s,X,Y,Z
0.000,0.000,1.000,0.000
0.020,0.088,0.993,0.027
0.040,0.175,0.972,0.054
0.060,0.261,0.936,0.078
0.080,0.345,0.888,0.100
0.100,0.426,0.826,0.119
0.120,0.504,0.753,0.135
0.140,0.578,0.669,0.146
0.160,0.647,0.576,0.153
th@Thomass-MacBook-Pro-7 bin %
The preceding file visualization rule recreates log.csv when tlog starts.
Its header is written once per sink; the quoted Go string supports \n.
Keep a single backslash in the shell’s single-quoted rule. log=drop suppresses
the successfully visualized records, while unrelated diagnostic logs remain.
For a live Serial Studio or other CSV viewer listening on UDP 9000, start
the decoder from the repository root before starting the binary producer:
trice log -p UDP4 -args 127.0.0.1:9001 -pf TCOBS -til demoTIL.json -utag vis_demo \
  -vis='vis_demo:printf("%0.6f,%0.6f,%0.6f,%0.6f\n",ts/100.0,v0,v1,v2)@udp://127.0.0.1:9000;log=drop'
In another terminal, also from the repository root:
examples/DemoData_Trice/bin/DemoData_Trice --udp 127.0.0.1 9001
On Windows the executable has an .exe suffix. The producer sends binary
Trice to 9001, not CSV; connecting it directly to the viewer on 9000
cannot work. The decoder converts its records to seconds,x,y,z. The LabPlot
launchers below automate this pipeline and its receiver-readiness checks.
2.4. Quick LabPlot demonstration
Install LabPlot 2.12 or newer. From the repository root, run one of these commands in a POSIX shell:
./examples/LabPlotDemo/run_csv.sh
./examples/LabPlotDemo/run_trice.sh
The script opens LabPlotDemo.lml and starts the selected producer. The first
script sends CSV directly to UDP port 9000. The second uses UDP port 9001
for binary Trice input and runs tlog as the decoder/forwarder to port 9000.
The script first waits until LabPlot has opened port 9000, then starts
tlog and waits until its input port 9001 is ready. Only then does it start
the Trice producer. The project opens one worksheet containing two plots side
by side:
Time series:x,y, andzversustime_s, always showing the last 500 values (ten seconds).Lissajous:yversusx, showing the last 150 values (three seconds) on fixed axes. The producer’s slow phase drift keeps the figure in motion.
Press Ctrl-C in the shell to stop the producer and decoder. If LabPlot is
not found automatically, set LABPLOT to its executable. On Windows, Git
Bash is a suitable shell; for example, use
LABPLOT=/c/Program\ Files/LabPlot/bin/labplot.exe.
2.5. Recreate the project in LabPlot
The following steps explain the project without requiring prior LabPlot
knowledge. Start run_csv.sh first and leave it running.
- Create a new LabPlot project and choose Add New > Live Data Source.
- Select Network UDP Socket, enter host
127.0.0.1and port9000. - Select the ASCII filter, comma as separator, and disable header detection.
Set all four data types to
Doubleand enter the namestime_s,x,y, andz. - Select Update on new data and retain
500values. This is the moving ten-second window at the demo’s 50 Hz rate. - Add a worksheet with a Cartesian plot. Add three XY curves. For every
curve choose
time_sas the X column and choosex,y, orzas the Y column. Enable the legend, label the axestime [s]andvalue, and enable automatic range scaling. In the plot’s range settings select Last values and enter500; otherwise the time axis keeps growing and the curves become increasingly compressed. - Add a second Cartesian plot to the same worksheet and select a horizontal
two-column worksheet layout. Add one XY curve with
xas its X column andyas its Y column. Select Last values and enter150. Fixed X and Y ranges from-1.1to1.1keep the scale stable while the three-second trace and the signal’s slow phase drift make the movement visible. - Save the project as
LabPlotUser.lml.
The finished LabPlotDemo.lml contains
these settings and no machine-specific paths. Open it manually if LabPlot is
already running. The LabPlotUser directory is the
place for your recreated LabPlotUser.lml; this section is its complete
rebuild guide. Both producers end at the same numeric UDP stream, for example
0.000000,0.000000,1.000000,0.000000.
Stop the producer and start the other launcher without changing the LabPlot
project. Keep only one producer sending to UDP 9000 and keep the live source
connected. The Trice launcher first waits for LabPlot on 9000, then for its
decoder on 9001. The supplied project predeclares all four numeric columns
and triggers an initial read when loaded so that LabPlot prepares its socket.
2.6. Troubleshooting and adaptations
labplotmust be discoverable or selected withLABPLOT. macOS also checks its standard application bundle. Windows searchesProgramFiles,ProgramW6432, andLOCALAPPDATAforlabplot.exeorlabplot2.exe; an explicitLABPLOToverride takes precedence.TLOGcan select a decoder outsidePATH. Producer executables stay in each demo’sbin/, with CMake intermediates inbuild/.- If the plots remain empty, verify that the producer is running and that no
other process owns UDP port
9000. - If
tlogreports that a-visrule was disabled because writing to port9000was refused, LabPlot was not listening when the decoder started. Restartrun_trice.sh; its readiness check normally prevents this race. Once a visualization rule is disabled, normal logging intentionally resumes, and itslog=dropoption is no longer applied. - For the Trice path, verify that
tlogis onPATHand thatdemoTIL.jsonis present at the repository root. SetTLOGorTRICE_TILwhen using non-default locations. - Keep the complete
-visexpression inside one pair of quotes. The semicolon separatesheaderandlogoptions inside that expression; it must not be interpreted by the shell. - To show another history length, change the retained-value count to
50 * seconds. For example,1000values show approximately 20 seconds. - The Trice path still uses UDP port
9001internally between the demo andtlog. If that port is busy, stop the other receiver or change it inrun_trice.shand its-argsvalue together.